
CVOL
Good measure or not?

Volatility is an indicator which every investor is looking at, especially following heightened levels since the COVID-19 pandemic and geopolitical events of 2022. While a stable measure before, it has become harder to estimate and there is never enough volatility measures.
The VIX provides a good measure of the stock market's expected volatility, however it is purely based on S&P500 index options. A more comprehensive measure of volatility may be needed to provide a better market overview: exactly where CVOL comes in.
What Is It?
CVOL is the CME Group's Volatility Index, and is a global volatility benchmark which is derived from the most-traded option contracts on futures covering multiple asset classes.
A typical screen of the index can be seen, whereby the full coverage of the index is shown:
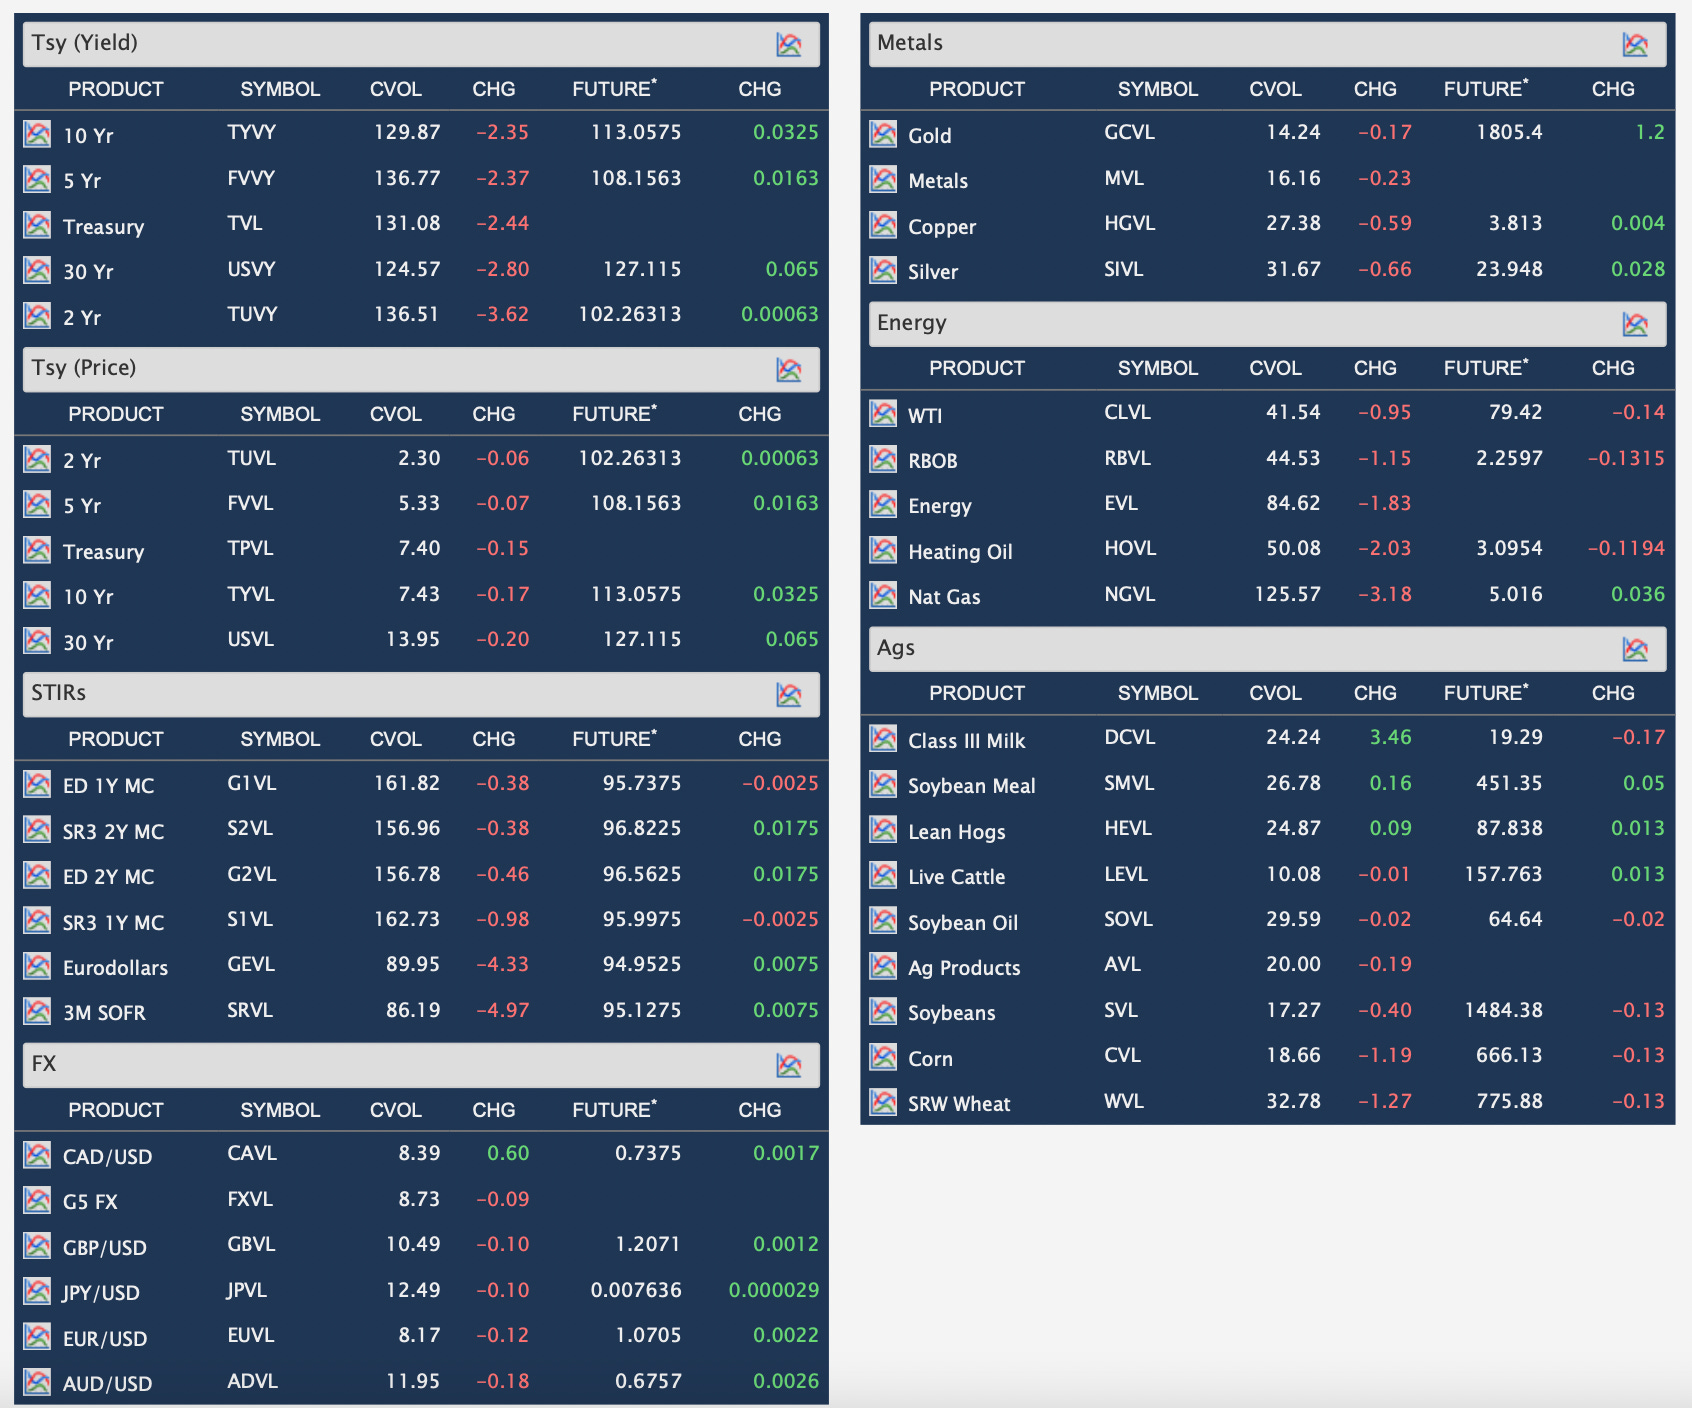
Providing real-time updates of volatility is a metric of paramount importance to investors, and so the CVOL's popularity has surged recently.
The CVOL estimates can be compared directly across asset classes, since the method of calculation is consistent across them. The estimates typically provide an estimate for the 30-day forward risk.
How Is It Calculated?
The CVOL is a variance calculation in simple terms.
Using data from a range of options with different strikes but the same expiration reveals that the price of ATM (at-the-money) options is higher than further OTM (out-of-money) options.
This is because if we take two put options with strike prices of $30 and $50, with the $50 put being ATM and the $30 put being OTM, then we should expect the price of the $50 put to be higher. The chances of the price of the underlying falling below an ATM option (the region in which the put option makes money) are greater than the chances of the price of the underlying falling below an OTM option. This is because if the price is currently $50 (ATM), then it only needs to fall $1 for the $50 put to make money, whereas it needs to fall $21 for the $30 put to make money. Therefore, the greater return for the $50 put needs to be reflected through a higher price of purchase.
The same relation can be seen with ATM and OTM call options, where higher the underlying price, the more OTM the call option is, and so the lower the option premium.
Plotting the option premium against strike price reveals an upward-sloping curve for puts, with a maximum at the strike price, and a downward-sloping curve for calls, with a maximum again at the strike price. The maximum is set since only OTM options are used.
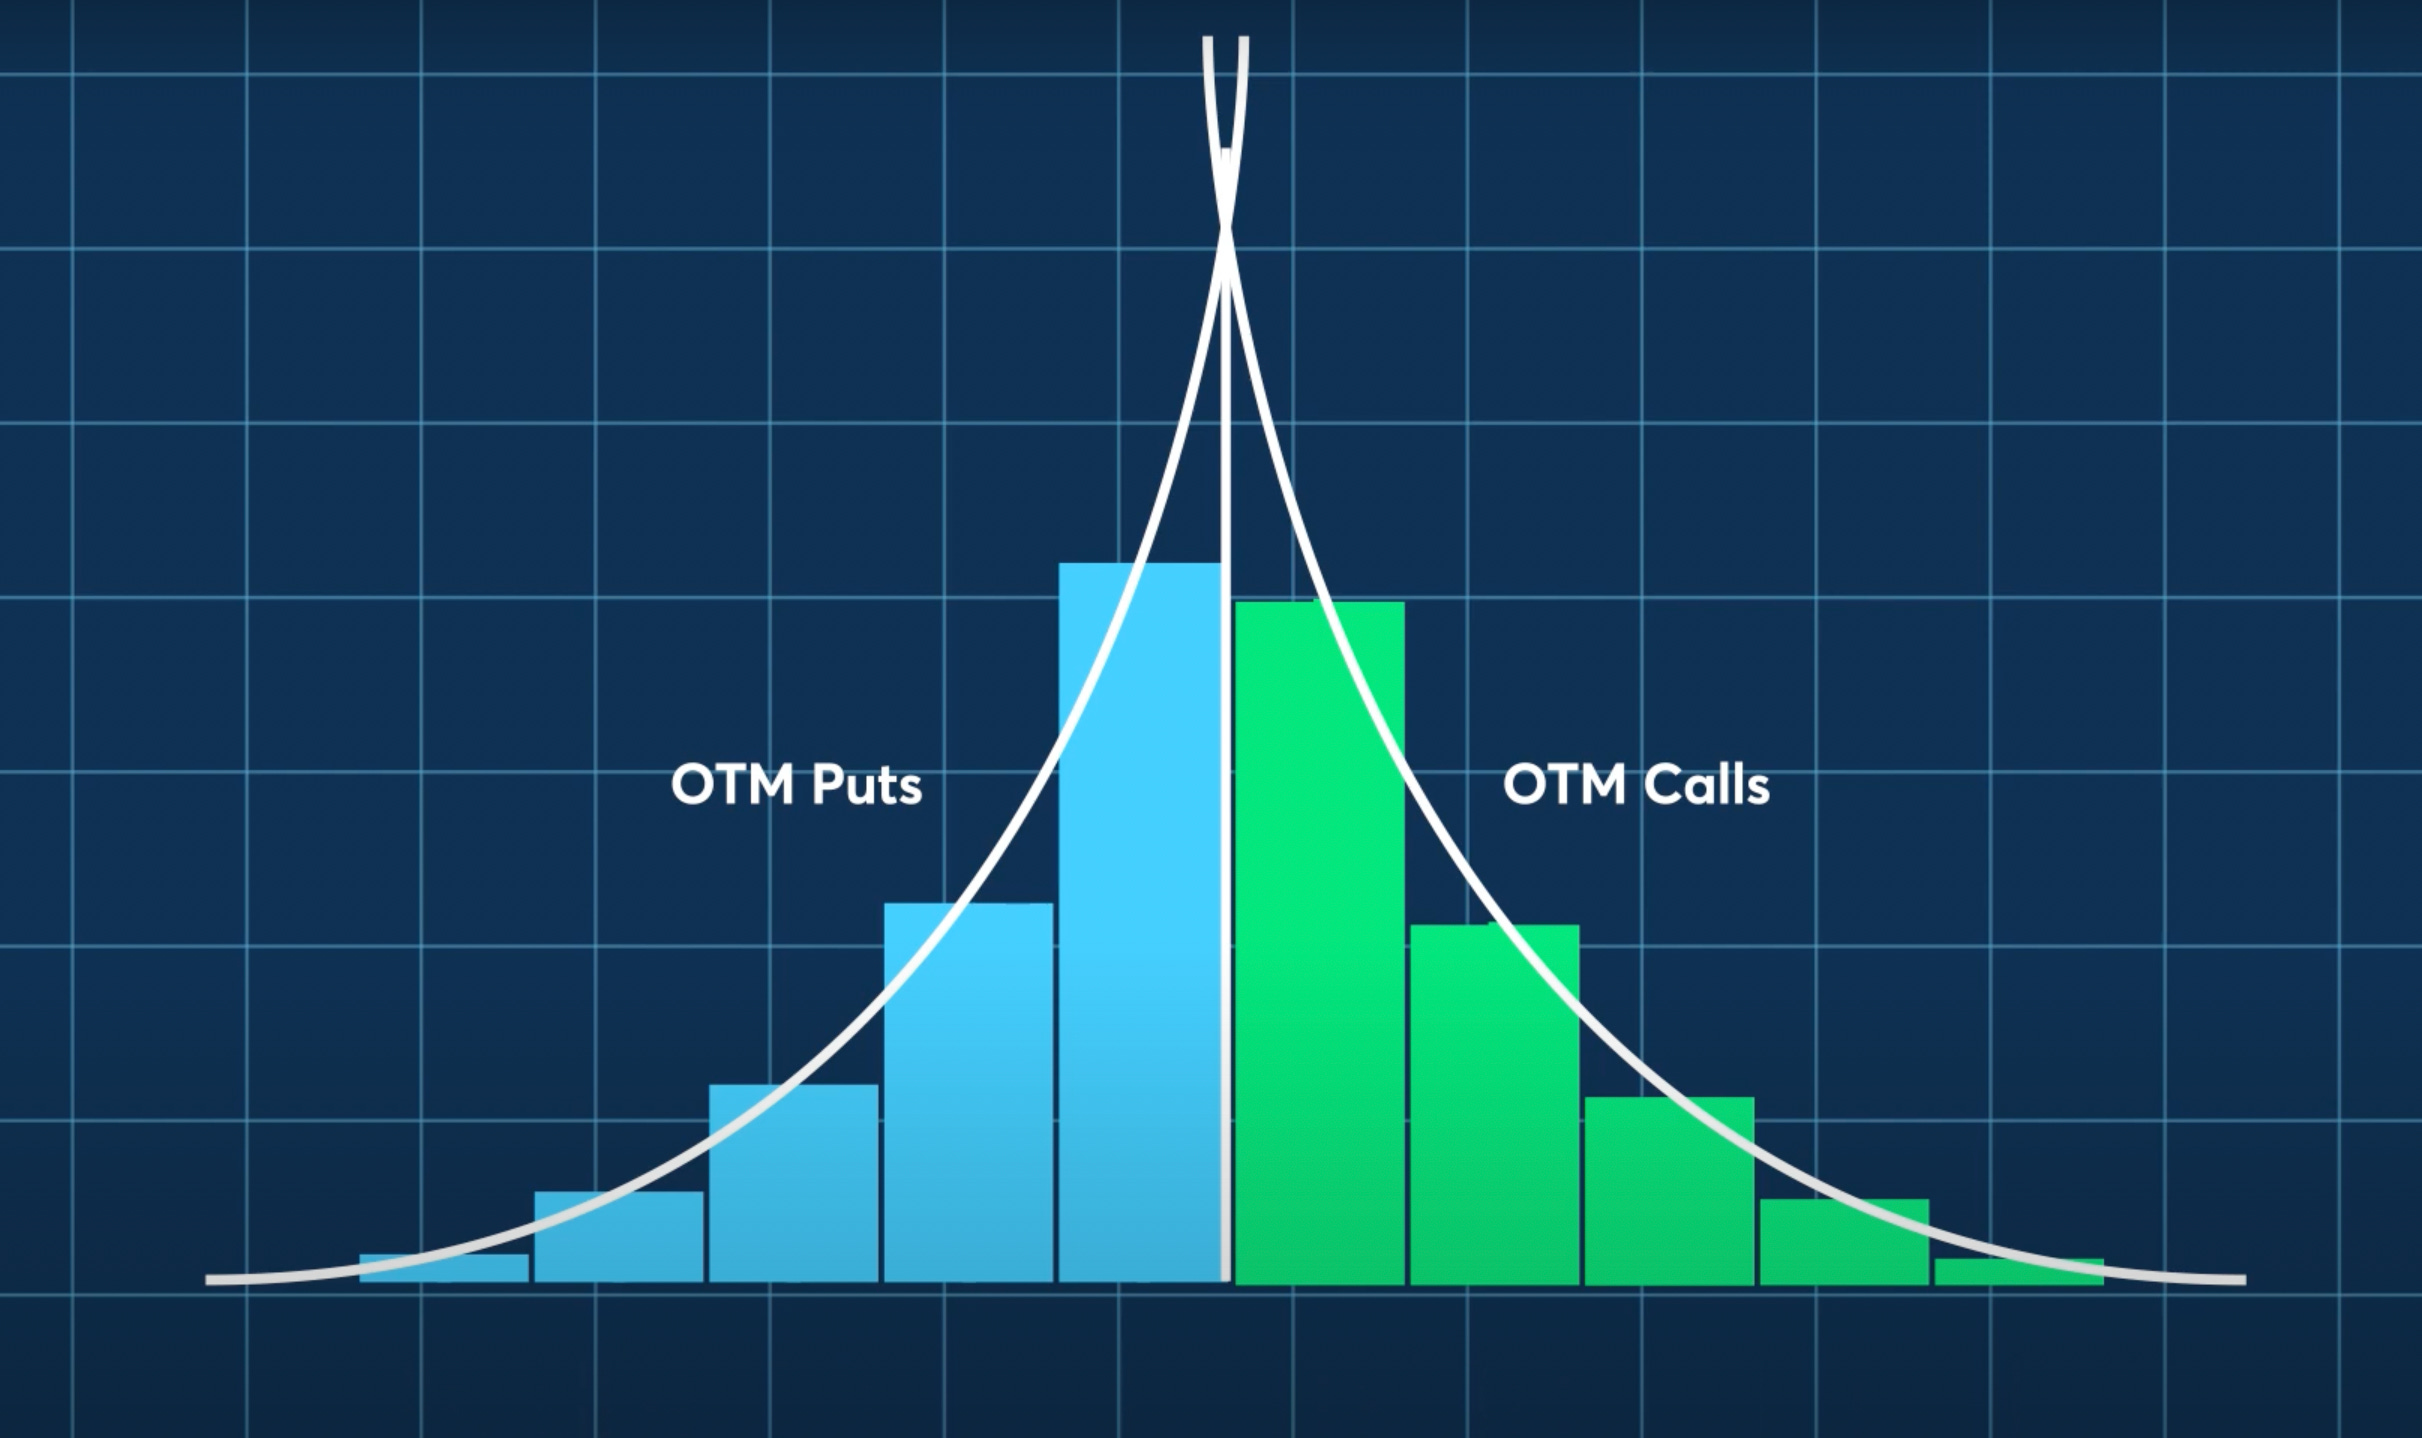
The total area under the two curves is representative of the implied variance in this set of options.
We can segment this area into individual rectangles, with the option price as the height and distance between adjacent strike prices as the base. Aggregating this gives a measure of the total area under the curve, and hence the implied variance.
Taking the square-root gives the standard deviation, and annualising this gives a volatility measure which is representative of the price of all options with the different strike prices.
What the CVOL allows investors to do is to see the volatility curve across all option strikes, rather than just implied volatility for ATM options, and so is a popular tool for volatility calculations.